
June 8, 2026
This is the Recycling, Scrap Metal, Commodities and Economic Report, June 8th, 2026, produced by BENLEE Roll-off trailers to support our customers, suppliers, and partners.
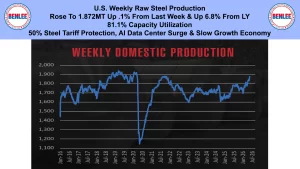
U.S. weekly raw steel production rose to 1.872MT up .1% from last week and up 6.8% from last year with 81.1% capacity utilization. This was on the 50% steel tariff protection, the AI data center surge, and the slow growth economy.
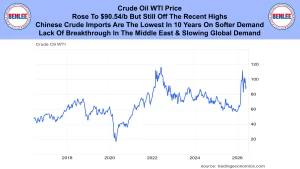
Crude oil WTI price rose to $90.54/b but is still off the recent highs. Chinese crude imports are the lowest in 10 years on softer demand. Also, there has been a lack of a breakthrough in the Middle East and on slowing global demand.
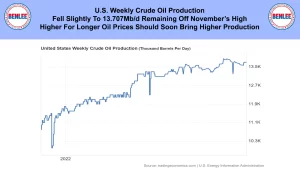
U.S. weekly crude oil production fell slightly to 13.707Mb/d remaining off November’s high. Higher for longer oil prices should soon bring higher production.
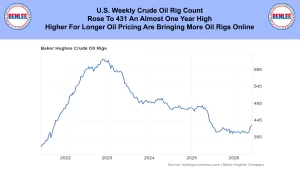
The U.S. weekly crude oil rig count rose to 431 an almost one year high. Higher for longer oil pricing are bringing more rigs online.
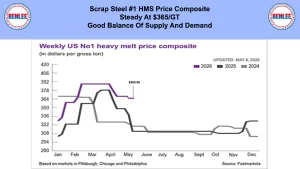
Scrap Steel #1 HMS Price Composite was steady at $365/GT on a good balance of supply and demand.
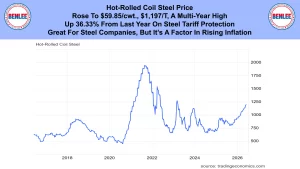
Hot-Roll Coil steel price rose to $59.85/cwt., $1,197/T a multiyear high. It is up 36.33% from last year on steel tariff protection. It is great for steel companies but a factor in rising inflation.
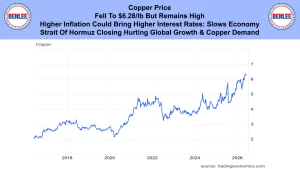
Copper Price fell to $6.28/lb. but remains high. Higher inflation could bring higher interest rates which slows the economy. The Strait of Hormuz closing is hurting global growth and copper demand.
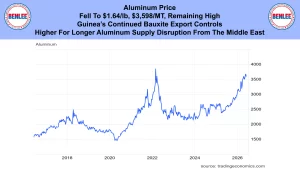
Aluminum price fell to $1.64/lb. which is $3,598/MT remaining high. This was on guinea continued bauxite export controls and higher for longer aluminum supply disruption from the Middle East.
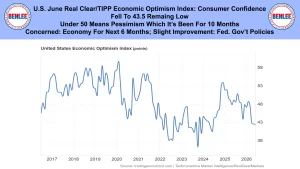
U.S. June Real Clear/TIPP economic optimism index, consumer confidence fell to 43.5 remaining low. Under 50 means pessimism which it has been for 10 months. People are concerned about the economy for the next six months. There was a slight improvement in how people feel about Federal Government policies.
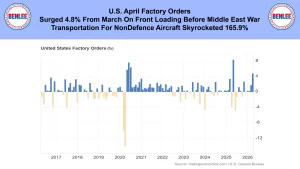
U.S. April Factory orders surged 4.8% from March on front loading before the Middle East war. Also, transportation orders for nondefense aircraft skyrocket 165.9%.
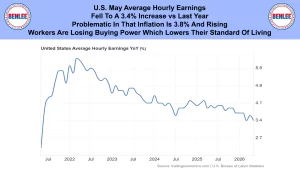
U.S. May average hourly earnings fell to a 3.4% increase vs last year. It is problematic in that inflation is 3.8% and rising. This means workers are losing buying power which lowers their standard of living.

U.S. May non-farm payrolls which is the New Jobs Report. The economy added 172,000 jobs well above forecast. Leisure and hospitality, local government, healthcare, and manufacturing added the most jobs.
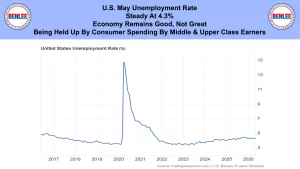
U.S. May unemployment rate was steady at 4.3%. The economy remains good, not great. It is being held up by consumer spending by middle and upper class earners.
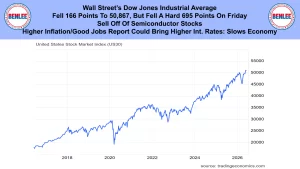
Wall Street’s Dow Jones Industrial Average fell 166 points to 50,867 but fell a hard 695 points on Friday with the selloff of semiconductor stocks. Higher inflation and the good jobs report could bring higher interest rates that slows the economy.

This report is brought to you by BENLEE roll-off trailers, Roll off trucks, gondola trailers, lugger trucks, roll off truck parts and dump truck and trailer parts. This is Greg Brown reporting from Athens, Greece.
As always, feel free to call or email me with any questions, and we hope all have a safe and profitable week.