
May 18, 2026
This is the Recycling, Scrap Metal, Commodities and Economic Report, May 18th, 2026, produced by BENLEE Roll off trailers to support our customers, suppliers, and partners.
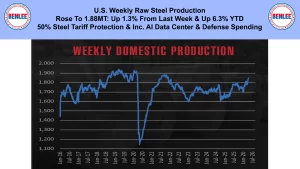
U.S. weekly raw steel production rose to 1.88MT up 1.3% from last week and up 6.3% YTD. This was on the 50% steel tariff protection, and increased AI data center and defense spending.
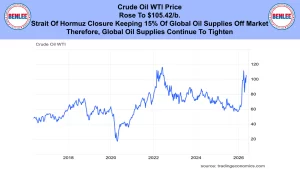
Crude oil WTI price rose to $105.42/b. This was on the Strait of Hormuz closure keeping about 15% of global oil supplies off the market therefore global oil supplies continue to tighten.
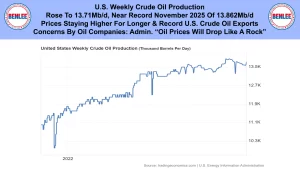
U.S. weekly crude oil production rose to 13.71Mb/d. near the record November 2025 of 13.862Mb/d. This was on the issue of prices staying higher for longer and record U.S. crude oil exports. There are concerns by oil companies that the administration has said oil prices will drop like a rock, which will hurt their profits.
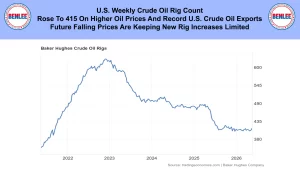
The U.S. weekly crude oil rig count rose to 415 on higher oil prices and record U.S. crude oil exports. Future falling prices are keeping new rig increases limited.
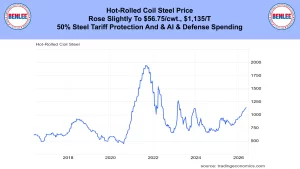
Hot-Rolled coil steel price rose slightly to $56.75/cwt., $1,135/T on the 50% steel tariff protection and AI and defense spending
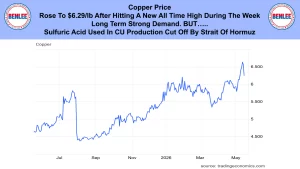
Copper price rose to $6.29/lb. after hitting a new high during the week on long-term demand but sulfuric acid supplies used in copper production have been cut by the strait of Hormuz closing.
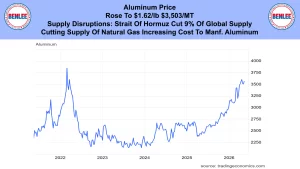
Aluminum price rose to $1.62/lb., which is $3,503/MT. This was on supply disruptions in the Strait of Hormuz which has cut 9% of global supply. Related the cutting off of natural gas suppliers from the Strait is increasing the cost to manufacture aluminum.
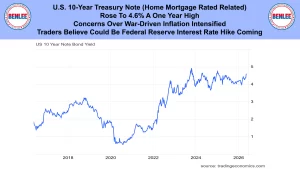
The U.S. 10-year treasury note which home mortgages are related to. It rose to 4.6% a one year high as concerns over war driven inflation intensified. Traders believe there could be a Federal Reserve interest rate hike coming.
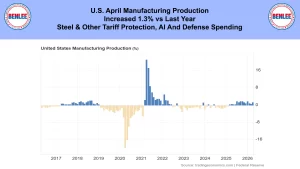
U.S. April manufacturing production increased 1.3% vs last year. This was on steel and other tariff protection and AI and defense spending.
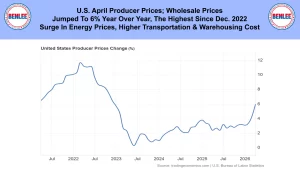
U.S. April producer prices, which are wholesale price, jumped 6% year over year, which was the highest since December 2022. This was on the surge in energy prices and higher transportation and warehousing cost.
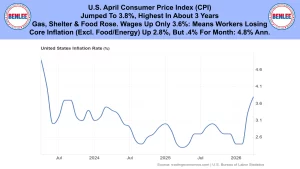
U.S. April consumer price index, CPI, jumped to 3.8% the highest in about 3 years. Gasoline, shelter, and food all rose. Wages are up only 3.6% which means workers are losing. Core inflation that excluded food and energy was up 2.8%, but up .4% for the month, which is 4.8% annually.
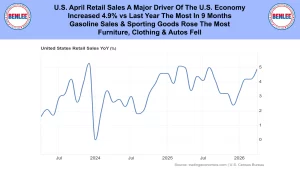
U.S. April retail sales. Retail sales are a major driver of the U.S. economy. They increased 4.9% vs last year the most in 9 months. Gasoline and sporting goods rose the most. Furniture, clothing, and autos fell.
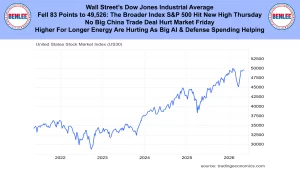
Wall Street’s Dow Jones Industrial Average fell 83 points to 49,526 as the broader index the S&P 500 hit a new high on Thursday. This was on no big China trade deal that hurt the market on Friday. Also, higher for longer energy prices are hurting as the big AI and defense spending is helping.
This report is brought to you by BENLEE Roll-off trailers, Roll off trucks, Gondola Trailers, Lugger Trucks, Roll-off trailer parts, Roll-off truck parts and dump truck and trailer parts. This is Greg Brown reporting.
As always, feel free to call or email me with any questions, and we hope all have a safe and profitable week.