
July 6, 2026
This is the Recycling, Scrap Metal, Commodities and Economic Report, July 6th, 2026, produced by BENLEE Roll-off trailers to support our customers, suppliers, and partners.
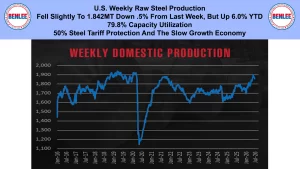
U.S. weekly raw steel production fell slightly to 1.842MT down .5% from last week, but up 6.0% YTD on 79.8% capacity utilization. This was on the 50% steel tariff protection and the slow growth economy.
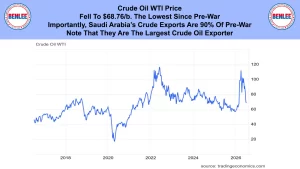
Crude oil WTI price fell to $68.76/b. the lowest since pre-war. Importantly, Saudi Arabia’s crude oil exports are 90% of pre-war. Note that they are the largest crude oil exporter.
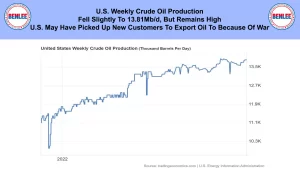
U.S. weekly crude oil production fell slightly to 13.810Mb/d., but remains high. The U.S. may have picked up some new customers to export oil to because of the war.
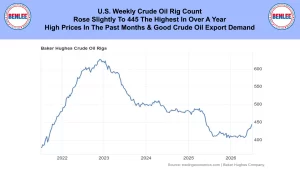
The U.S. weekly crude oil rig count rose slightly to 445 the highest in over a year. This was on high prices in the past months and good crude oil export demand.
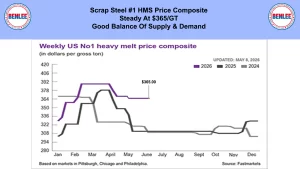
Scrap Steel #1 HMS price composite was steady at $365/GT on a good global balance of supply and demand.
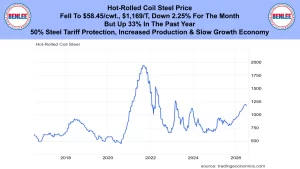
Hot-Roll Coil steel price fell to $58.45/cwt. which is $1,169/T down 2.25% for the month but up 33% in the past year. This was on the 50% steel tariff protection, increased steel production, and the slow growth economy.
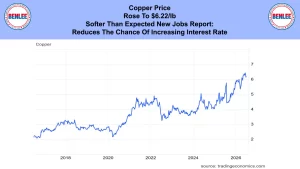
Copper Price rose to $6.22/lb. This was on the softer than expected new jobs report that reduces the chance of increasing interest rates.
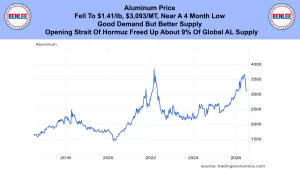
Aluminum price fell to $1.41/lb, $3,093/MT near a 4 month low. This was on good demand, but better supply. The opening of the Strait of Hormuz freed up about 9% of global aluminum supply.
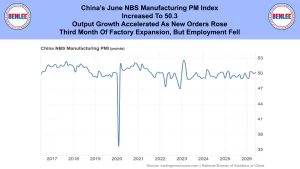
China’s June NBS manufacturing purchasing managers’ index increased to 50.3. Output growth accelerated as new orders rose. It was the third month of factory expansion, but employment fell.
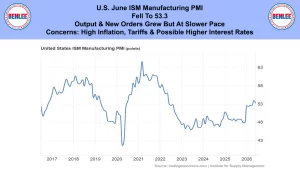
U.S. June ISM manufacturing purchasing managers index fell to 53.3. Output and new orders grew but at a slower pace. There were concerns about high inflation, tariffs, and possible higher interest rates.
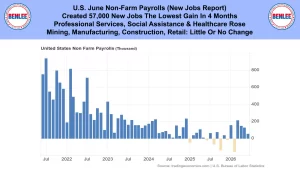
U.S. June non-farm payrolls, the new jobs report. The U.S. created 57,000 jobs, the lowest gain in 4 months. Professional services, social assistance, and healthcare rose. Mining, manufacturing, construction, and retail had little or no change.
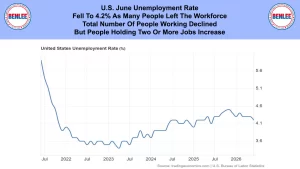
The U.S. June unemployment rate fell to 4.2% as many people left the workforce. The total number of people working declined, but people holding two or more jobs increased.
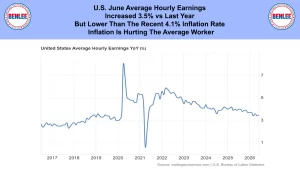
U.S. June average hourly earnings increased 3.5% vs last year, but lower than the recent 4.1% inflation rate. Inflation is hurting the average worker.
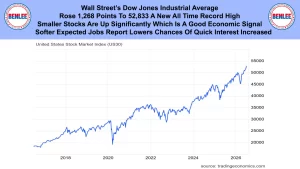
Wall Street’s Dow Jones Industrial Average rose 1,268 points to 52,833 a new record high. Smaller stocks are up significantly, which is a good economic signal. The softer than expected jobs report lowers the chances of a quick interest rate increase.
This report is brought to you by BENLEE roll-off trailers, Roll off trucks, gondola trailers, lugger trucks, roll off truck parts and dump truck and trailer parts. This is Greg Brown reporting.
As always, feel free to call or email me with any questions, and we hope all have a safe and profitable week.