
June 29, 2026
This is the Recycling, Scrap Metal, Commodities and Economic Report, June 29th, 2026, produced by BENLEE Roll-off trailers to support our customers, suppliers, and partners.

U.S. weekly raw steel production fell slightly to 1.851MT down .2% from last week, but up 6.1% YTD on 79.8% capacity utilization. This was on the 50% steel tariff protection slow growth economy, but the AI data center boom.

Crude oil WTI price fell to $69.23/b the lowest in 4 months. This was as oil volumes through the Strait of Hormuz accelerated.
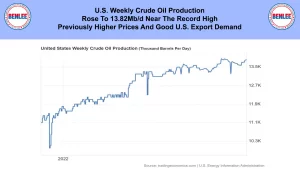
U.S. weekly crude oil production rose to 13.81Mb/d near the record high. This was on the previously higher prices and good U.S. export demand.

The U.S. weekly crude oil rig count rose to 44 the highest in about a year. This was on the same previously higher oil price on good export demand.
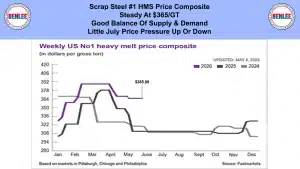
Scrap Steel #1 HMS Price Composite was steady at $365/GT on a good balance of supply and demand. There is little July price pressure up or down.
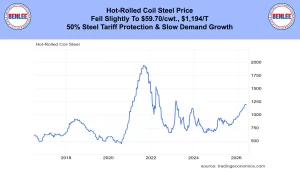
Hot-Roll Coil steel price fell slightly to $59.70/cwt which is $1,195/T on the 50% steel tariff protection and the slow growth in demand
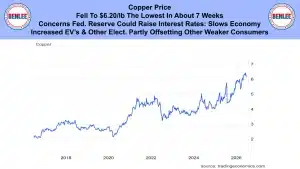
Copper Price fell to $6.20/lb., the lowest in about 7 weeks. There are concerns that the Federal Reserve could raise interest rates which will slow the economy. Also, increased Electric vehicles and other electrification is partly offsetting other weaker consumers.
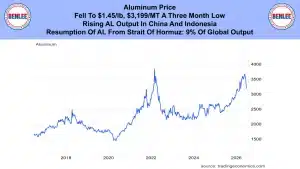
Aluminum price fell to $1.45/lb. which is $3,199/MT a three month low. This was on rising aluminum output in China and Indonesia. Also, it was on the resumption of aluminum shipments from the Strait of Hormuz with is 9% of global aluminum output.
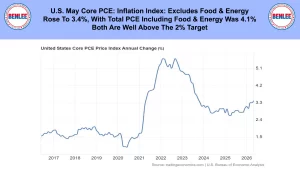
U.S. May Core PCE inflation index that excludes food and energy. It rose to 3.4%, with the total PCE including food and energy was 4.1%. Both were well above the 2% target.
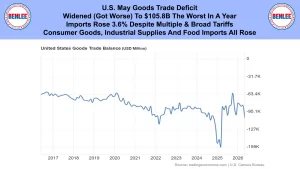
U.S. May goods trade deficit widened as in got worse to $105.8B the worse in a year. Imports rose 3.6%, despite multiple and broad tariffs. Consumer goods, industrial supplies, and food rose.
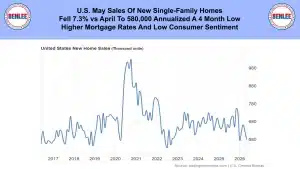
U.S. May sales of new single-family homes fell to 7.3% vs April to 580,00 annualized a 4 month low on higher mortgage rates and low consumer sentiment.
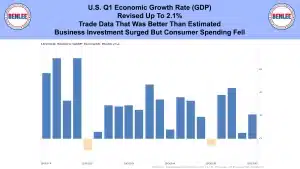
U.S. Q1 Economy growth rate, GDP was revised up to 2.1% on trade data that was better than expected. Also, as business investment increased, consumer spending fell.
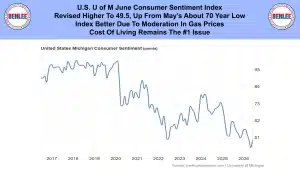
U.S. U of M June Consumer Sentiment Index was revised higher to 49.5. Up from May’s about 70 year low. Index was better due to moderation in gas prices, as the cost of living remain the number 1 issue
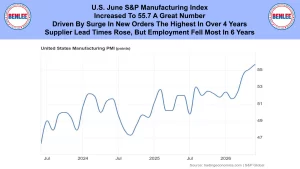
U.S. June S&P Manufacturing Index increased to 55.7 a great number. Driven by surge in new orders the highest in over 4 years. Supplier lead times rose, but employment fell the most in 6 years.
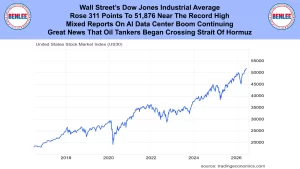
Wall Street’s Dow Jones Industrial Average rose 363 points to 51,565 down from the record high during the week. People are positive about the Middle East deal, but that was tempered by the Federal Reserve possible higher interest rates.
This report is brought to you by BENLEE roll-off trailers, Roll off trucks, gondola trailers, lugger trucks, roll off truck parts and dump truck and trailer parts. This is Greg Brown reporting.
As always, feel free to call or email me with any questions, and we hope all have a safe and profitable week.