
May 11, 2026
This is the Recycling, Scrap Metal, Commodities and Economic Report, May 11th, 2026, produced by BENLEE Roll off trailers to support our customers, suppliers, and partners.
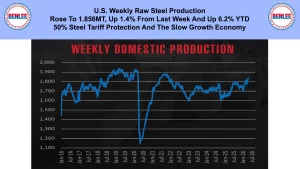
U.S. weekly raw steel production rose to 1.856MT up 1.4% from last week and up 6.2% YTD. This was on the 50% steel tariff protection and the slow growth economy.
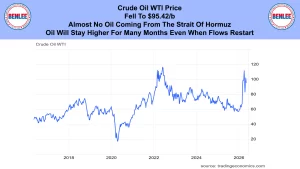
Crude oil WTI price fell to $95.42/b with almost no oil coming from the Strait of Hormuz. Oil will stay higher for many months even when flows restart.
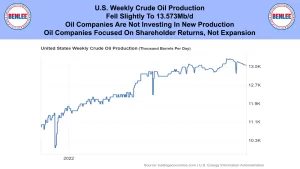
U.S. weekly crude oil production fell slightly to 13.573Mb/d. as oil companies are not investing in new production. This is as oil companies are focused on shareholder returns, not expansion.
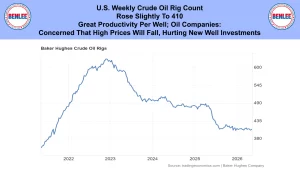
The U.S. weekly crude oil rig count rose slightly to 410. This was on great productivity per well. Oil companies are concerned that high prices will fall, hurting new well investments.
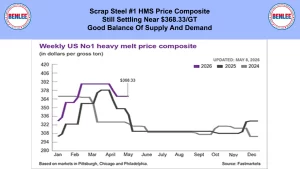
Scrap steel #1 HMS price composite was still settling near $368.33/GT on a good balance of supply and demand.
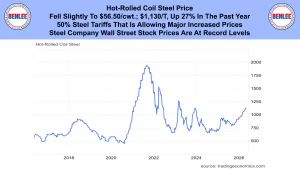
Hot-Rolled coil steel price fell slightly to $56.50/cwt., which is $1,130/T up 27% in the past year. This was on the 50% steel tariff that is allowing major increased prices. Steel company Wall Street stock prices are at record levels.
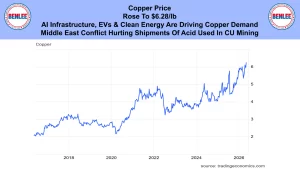
Copper price rose to $6.28/lb as AI infrastructure, electric vehicles and clean energy are driving copper demand. Also, the Middle East conflict is hurting shipments of acid used in copper mining.
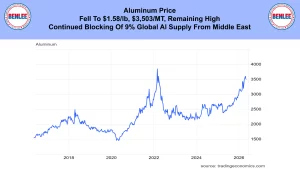
Aluminum price fell to $1.58/lb., $3,503/MT remaining high. This was on the continued blocking of 9% of global supply of aluminum from the Middle East.
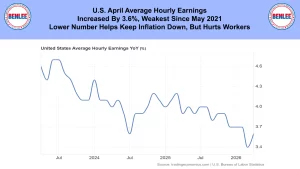
U.S. April average hourly earnings increased by 3.6% the weakest since May 2021. The lower number helps keep inflation down, but hurts workers.
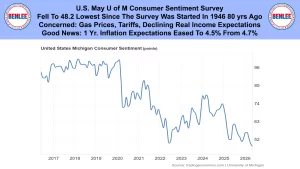
May U of M consumer sentiment survey fell to 48.2 the lowest since the survey was started in 1946, 80 years ago. People are concerned about gas prices, tariffs, and declining real income expectations. The good news is that 1 year inflation expectations eased to 4.5% from 4.7%.
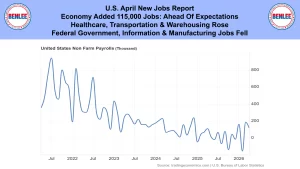
U.S. April new jobs report show the economy added 115,000 jobs which was ahead of expectations. Healthcare, transportation, and warehousing rose and federal government, information and manufacturing jobs fell.
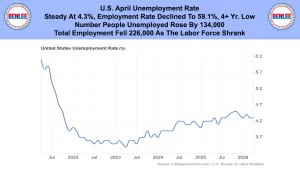
The U.S. April unemployment rate was steady at 4.3% as the employment rate declined to 59.1% a 4 plus year low. The number of unemployed rose by 134,000 as total employment fell by 226,000 as the labor force shrank.
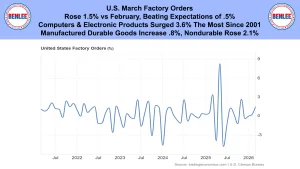
U.S. March factory orders rose 1.5% vs February beating expectations of .5%. Computers and electronic products surged 3.6% the most since 2001. Manufactured durable goods increased .8% as non-durable goods rose 2.1%.
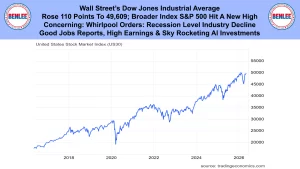
Wall Street’s Dow Jones Industrial Average rose 110 points to 49,609 as the broader index, the S&P 500 hit a new high. It is concerning that Whirlpool orders hit a recession level industry decline. The high though were on the good jobs report, higher earnings, and sky rocketing AI investments.
This report is brought to you by BENLEE Roll-off trailers, Roll off trucks, Gondola Trailers, Lugger Trucks, Roll-off trailer parts, Roll-off truck parts and dump truck and trailer parts. This is Greg Brown reporting.
As always, feel free to call or email me with any questions, and we hope all have a safe and profitable week.